Vera Vogel · 20 November 2026
How Animated Diagrams Expose Recurring Loops in Traffic Between Independent Online Projects
Animated diagrams have become a practical tool for mapping traffic movement across standalone websites and online projects that operate without central coordination. These visualizations convert raw referral logs and server data into moving sequences that highlight cycles where visitors return repeatedly through the same pathways between unrelated domains. Researchers in web analytics have documented how such diagrams make visible the loops that static charts often obscure because the motion draws attention to repeated back-and-forth exchanges that occur over weeks or months.
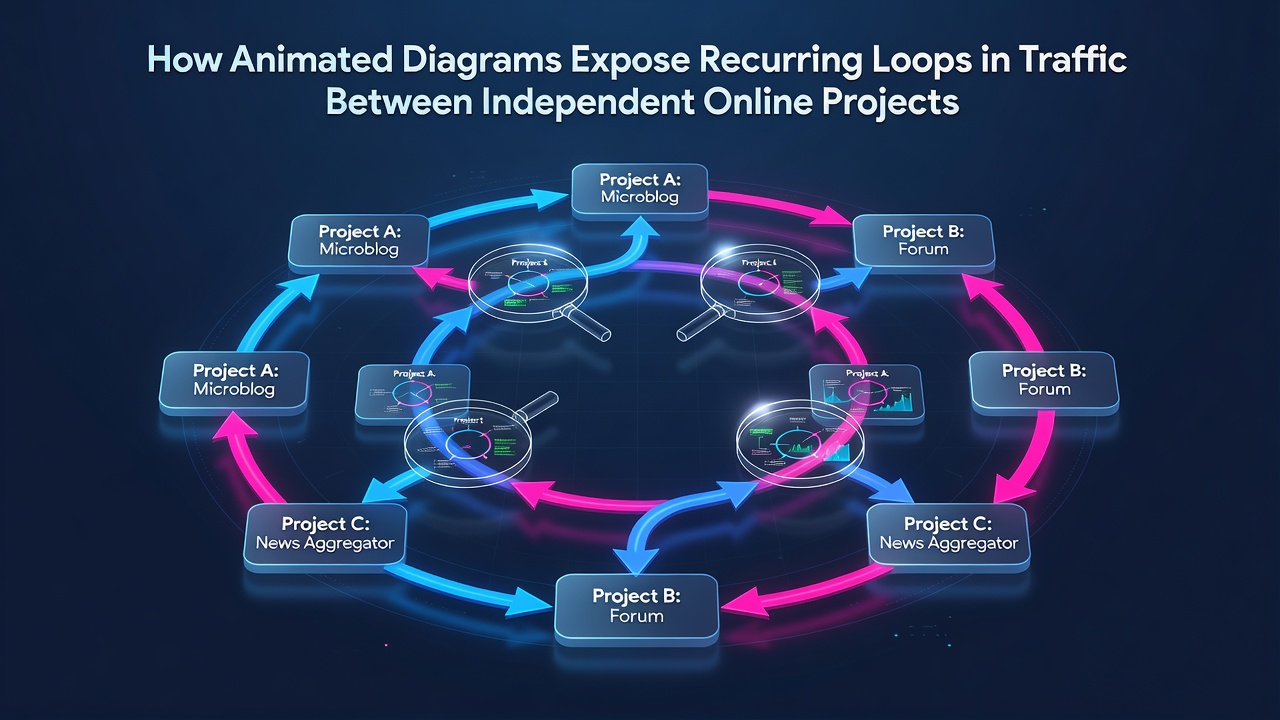
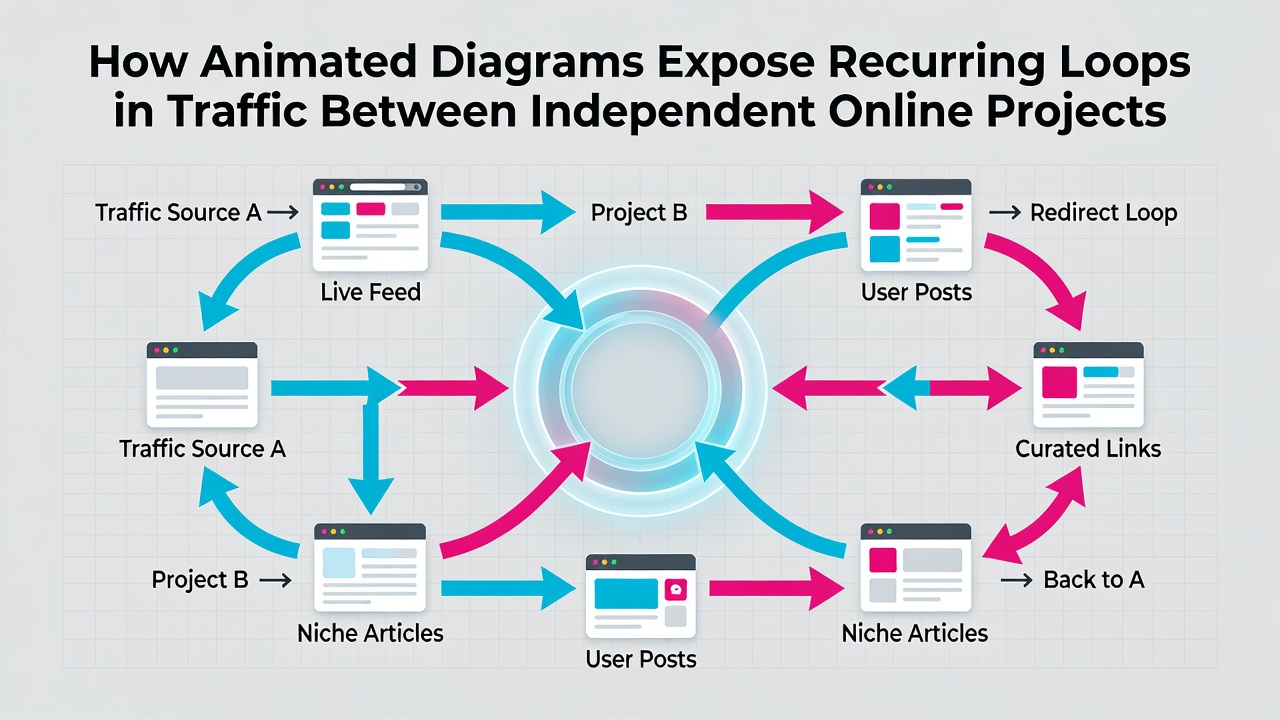
Data collected from independent sites shows that traffic does not always follow linear paths from one source to another. Instead, certain clusters of projects exchange visitors in closed circuits where a user who arrives from project A moves to project B and then returns through a different entry point on project A. Animated diagrams expose these patterns by replaying the sequence at accelerated speeds so analysts can observe the rhythm of the exchanges rather than isolated spikes.
Mechanics of Animated Traffic Visualization
Specialized software processes timestamped referral data and renders it as flowing lines or particle streams that advance across a network graph. Each frame represents a slice of time so the viewer sees traffic building, peaking, and cycling back within defined intervals. The animation layer adds velocity indicators and color gradients that shift when a loop closes, making it easier to distinguish one-time referrals from sustained circular movement. Observers note that this temporal dimension allows identification of loops that span multiple days or recur at predictable intervals such as weekly or monthly.
Independent projects often share thematic overlaps even when they maintain separate ownership and hosting. A diagram might reveal that visitors who read content on a technology blog then navigate to an open-source documentation site and later return via a forum thread that links back to the original blog. The animation makes the return leg stand out because the path retraces itself rather than terminating at the second destination. Studies conducted on public web logs have confirmed that these closed loops account for measurable portions of total referral volume once the motion reveals their structure.
Patterns Identified Through Motion Analysis
Multiple analyses of referral networks demonstrate that recurring loops frequently involve three or more projects rather than simple pairs. An animated view can illustrate how traffic circulates through a triangle of sites where each acts alternately as source and destination. The motion also highlights timing: some loops complete within hours while others require several days to close. In November 2026, analysts reviewing aggregated logs from that period recorded elevated loop activity coinciding with major open-source releases that drove cross-site discussion threads.
Animated diagrams further separate organic loops from those influenced by shared advertising networks or affiliate programs. When the animation shows consistent pacing independent of paid campaigns, researchers conclude the pattern stems from content-driven navigation. Figures from large-scale crawl datasets indicate that such self-sustaining loops appear more often among projects that publish on overlapping topics even when the sites themselves remain editorially distinct.
Applications for Project Operators
Operators of independent sites use these diagrams to adjust internal linking structures and content calendars. When a loop appears, they can examine the specific pages that participate in the cycle and determine whether additional entry points or exit links would alter the pattern. The visual evidence also supports decisions about partnership outreach because the animation shows which external projects already contribute to sustained traffic circulation.
Network researchers have applied similar animation techniques to study how new projects integrate into existing loops. Early data points often show one-way traffic until the new site produces content that prompts return visits, at which point the diagram begins rendering a closed path. This transition becomes visible within days rather than weeks when the animation runs at appropriate speed.
Data Sources and Measurement Considerations
Public datasets from organizations such as Pew Research Center provide baseline referral statistics that analysts compare against animated outputs. Additional context comes from reports issued by Statistics Canada on digital content consumption patterns. These sources supply aggregate numbers that help calibrate the scale of loops observed in smaller independent networks. The combination of broad statistical benchmarks with granular animated views allows observers to assess whether a detected cycle represents an outlier or a common occurrence across the wider web.
Conclusion
Animated diagrams transform static referral counts into dynamic sequences that reveal the circular traffic structures connecting independent online projects. By rendering time-based movement, these tools make recurring loops visible so analysts can measure their frequency, duration, and participant sites. The approach relies on existing server logs and publicly available research benchmarks rather than proprietary tracking, which keeps the method accessible to operators of standalone platforms. Continued refinement of animation parameters continues to improve the clarity with which these traffic patterns appear in network visualizations.